Waves, sound and light: Describe, analyse and apply principles of longitudinal waves in everyday life
Unit 2: Perception and applications of sound
Dylan Busa
Unit 2 outcomes
By the end of this unit you will be able to:
- Differentiate between:
- intensity and loudness
- pitch and tone.
- Describe interference and reflection in sound and give examples.
What you should know
Before you start this unit, make sure you can:
- Identify examples of longitudinal waves.
- Describe and calculate:
- wave speed
- wavelength
- frequency
- amplitude.
Introduction
As a foetus in our mothers’ wombs, sound is one of the first outside inputs we respond to. There is good evidence that by the time a baby is born, it knows the sound of its mother’s voice.

Humans are constantly surrounded by sound whether they consciously register it or not. Most people notice immediately when there is complete silence. Humans (like other animals) use sound to interpret the world around them. Human ears are quite remarkable at being able to pick up and register a huge range of sounds and can even immediately tell from what direction a sound comes by comparing the sound wave that arrives at each ear.
As we learnt in the previous unit, sound is an example of a longitudinal wave. If the sound is loud enough, we can sometimes ‘feel’ it as our bodies register the change in air pressure caused by the pressure wave. Animals such as snakes and spiders do not have ears. They sense the vibrations caused by longitudinal waves that travel through the ground.
In this unit we will build on our knowledge of the properties of sound as a longitudinal wave to understand how the perceptual qualities of sound (its volume and pitch) relate to the characteristics of the sound wave. You will also learn about some real-world applications of the behaviour of longitudinal waves.
The anatomy of sound
Sound is produced when something vibrates and creates a disturbance in the air. These pulses form a longitudinal wave that travels through the air to our ears (see figure 2).

The sound wave is captured and funnelled into the ear by the structures of the outer ear (see figure 3). The compressions and rarefactions cause the eardrum (the tympanic membrane) to vibrate, which, in turn, causes the tiny bones in the middle ear to vibrate. These vibrations are converted into nerve signals by the cochlea, which then travel to the brain where they are interpreted as the sounds.

Note
If you have an internet connection watch the following excellent explanation of how we hear.
Sound is richer and more complicated than we may first realise. It has three important characteristics – loudness (or volume), pitch and tone.
Loudness and intensity
Sounds can be at different volumes. As you lie in your bed at night, it might be quiet enough for you to hear the blood pumping in your ears. Other times, music may be so loud you cannot hear the person shouting next to you.
The volume or loudness of a sound is a determined by the amplitude of the wave. The greater the amplitude, the greater the loudness we will perceive. However, as we get further away from a loud sound it sounds softer. Perceived loudness also differs for sounds of different frequencies. We need a better, more objective measure of loudness.
This better measure is called the intensity of the sound. Intensity is defined as the power (in watts) per unit area ([latex]\scriptsize \displaystyle \frac{\text{W}}{{{{\text{m}}^{\text{2}}}}}[/latex]). Remember, all waves transmit energy over a distance and sound is no different. The amount of energy in the wave is determined by the amplitude of the wave. We know that the amplitude of a longitudinal wave is the maximum deviation in pressure that particles in the medium experience from equilibrium. It makes sense then that the greater this deviation in pressure, the greater the energy that is transmitted by the wave.
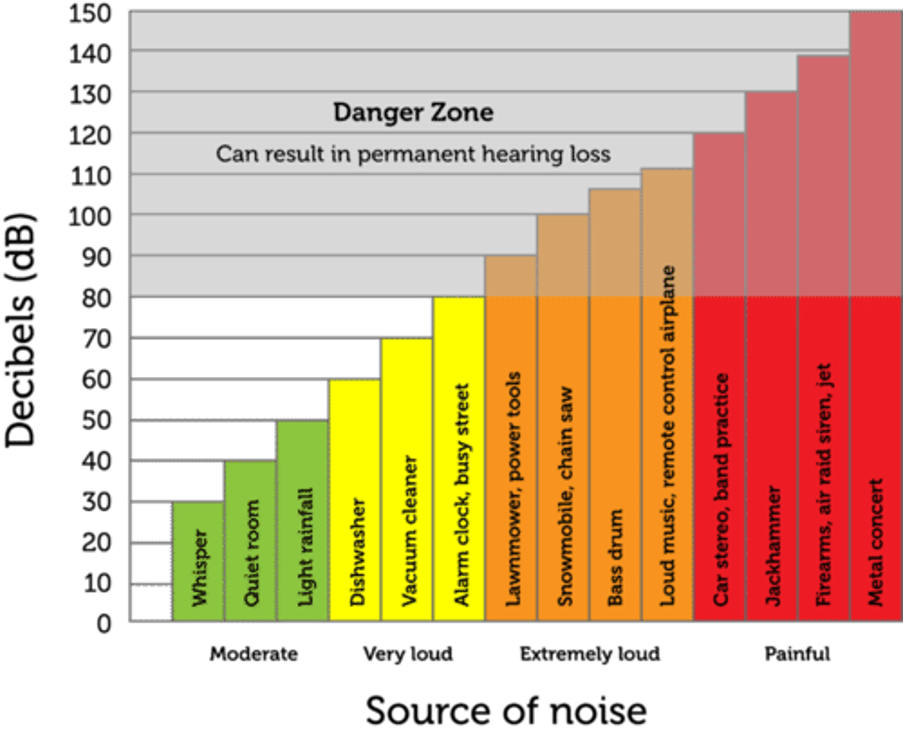
We measure intensity in decibels ([latex]\scriptsize \text{dB}[/latex]). To help us compare the intensity of different sounds, we use the decibel scale. The decibel scale starts at zero – the threshold of hearing. The scale is not linear though. It is logarithmic. This means that a [latex]\scriptsize 10\ \text{dB}[/latex] sound (like the rustle of leaves) is ten times louder and a [latex]\scriptsize 20\ \text{dB}[/latex] whisper is ten times louder still.
Have a look at the decibel scale in figure 4. It shows the intensities of different kinds of sounds and the threshold where our hearing can be permanently damaged. Remember that a dishwasher at [latex]\scriptsize 60\ \text{dB}[/latex] is [latex]\scriptsize 100[/latex] times louder than a quiet room at [latex]\scriptsize 40\ \text{dB}[/latex].
Take note!
Loudness refers to how loud or soft a sound seems to a listener. The loudness of sound is determined, in turn, by the intensity of the sound waves. Intensity is a measure of the amount of energy in sound waves and is measured in [latex]\scriptsize \text{W/m}^{2}[/latex]. Measuring the intensity of sound this way is not very practical so the decibel intensity scale was developed which compares the intensity of different sounds relative to a reference value. The decibel scale is logarithmic which means that a sound intensity of [latex]\scriptsize 10\ \text{dB}[/latex] is [latex]\scriptsize 10[/latex] times lounder than a sound of [latex]\scriptsize 0\ \text{dB}[/latex] (the quietest audible sound) but a sound of [latex]\scriptsize 20\ \text{dB}[/latex] is [latex]\scriptsize 100[/latex] times louder.
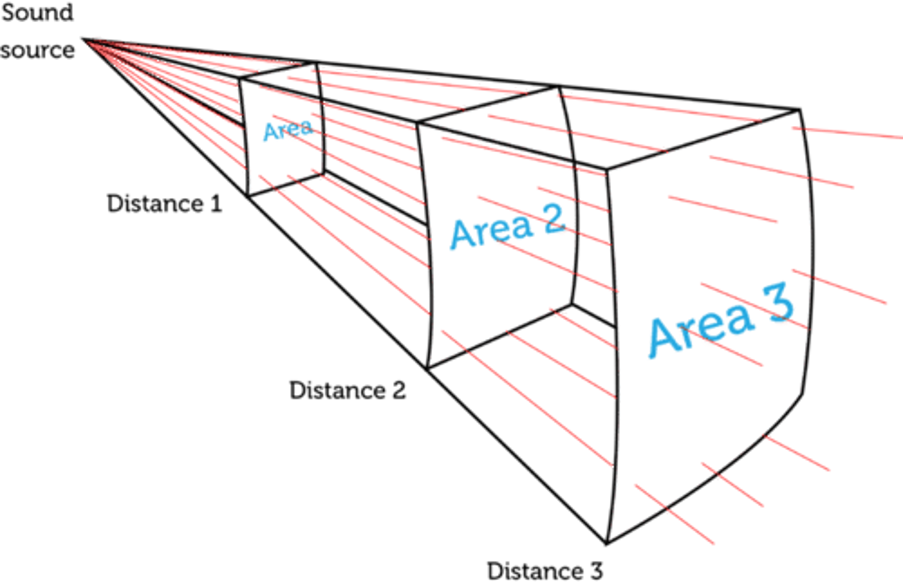
The reason why the intensity of sound decreases the further away you are from the source is that the energy of the sound wave is spread over a greater and greater area (see figure 5) and so the energy per unit area falls.
Pitch and tone
Some sounds have a high pitch, like a baby crying or the whine of a siren. Others have a low pitch, like the bass riff in your favourite song.
The pitch of a sound is determined by the frequency of the sound wave. Higher-frequency sound waves are perceived as higher-pitched sounds.
Humans can generally hear sounds between about [latex]\scriptsize 20\ \text{Hz}[/latex] and [latex]\scriptsize 20\ 000\ \text{Hz}[/latex]. Sounds with frequencies below [latex]\scriptsize 20\ \text{Hz}[/latex] are called infrasound. Infrasound is too low-pitched for humans to hear. Sounds with frequencies above [latex]\scriptsize 20\ 000\ \text{Hz}[/latex] are called ultrasound. Ultrasound is too high-pitched for humans to hear.
Did you know?
Some animals can hear sounds in the ultrasound range. For example, dogs can hear sounds with frequencies as high as [latex]\scriptsize 50\ 000\ \text{Hz}[/latex]. Special dog whistles produce sounds with frequencies too high for the human ear to detect but that dogs hear just fine. Bats can hear even higher-frequency sounds – up to [latex]\scriptsize 120\ 000\ \text{Hz}[/latex]! They use the echoes or reflections of these sound waves off objects to find their way around. This is called echolocation. Dolphins can hear sounds up to [latex]\scriptsize 200\ 000\ \text{Hz}[/latex]!
The tone of a sound can be described as the ‘quality’ of the sound. Tone is subjective. Some sounds are warm. Others are bright. Some are dark while others are shrill. This is why two instruments can play the very same note, but you will be able to hear the difference. Each type of instrument (and even each individual instrument) has its own tone. Tone results from the complex interplay of many different aspects of the object creating the sound including its size and shape, the material it is made from, how it is played and even the skill of the person playing it. Have you ever heard the tone made by someone learning to play the violin vs a maestro?! We will learn more about this in the next unit.
Comparing sounds
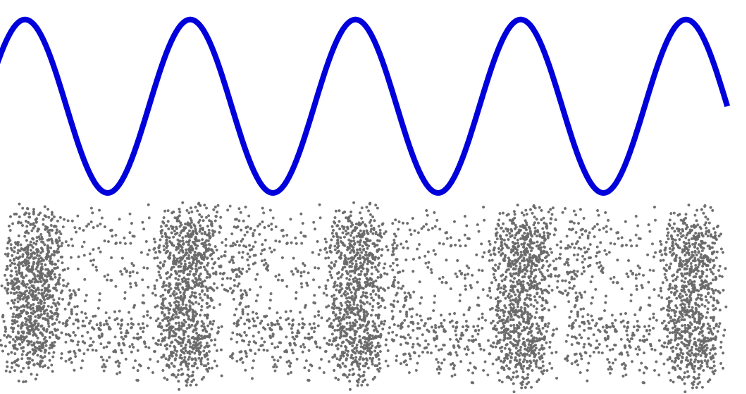
When we compare sounds, we often represent the longitudinal wave as a transverse wave where the compressions are represented by peaks and the rarefactions by troughs (see figure 6). This makes it easier to visualise.
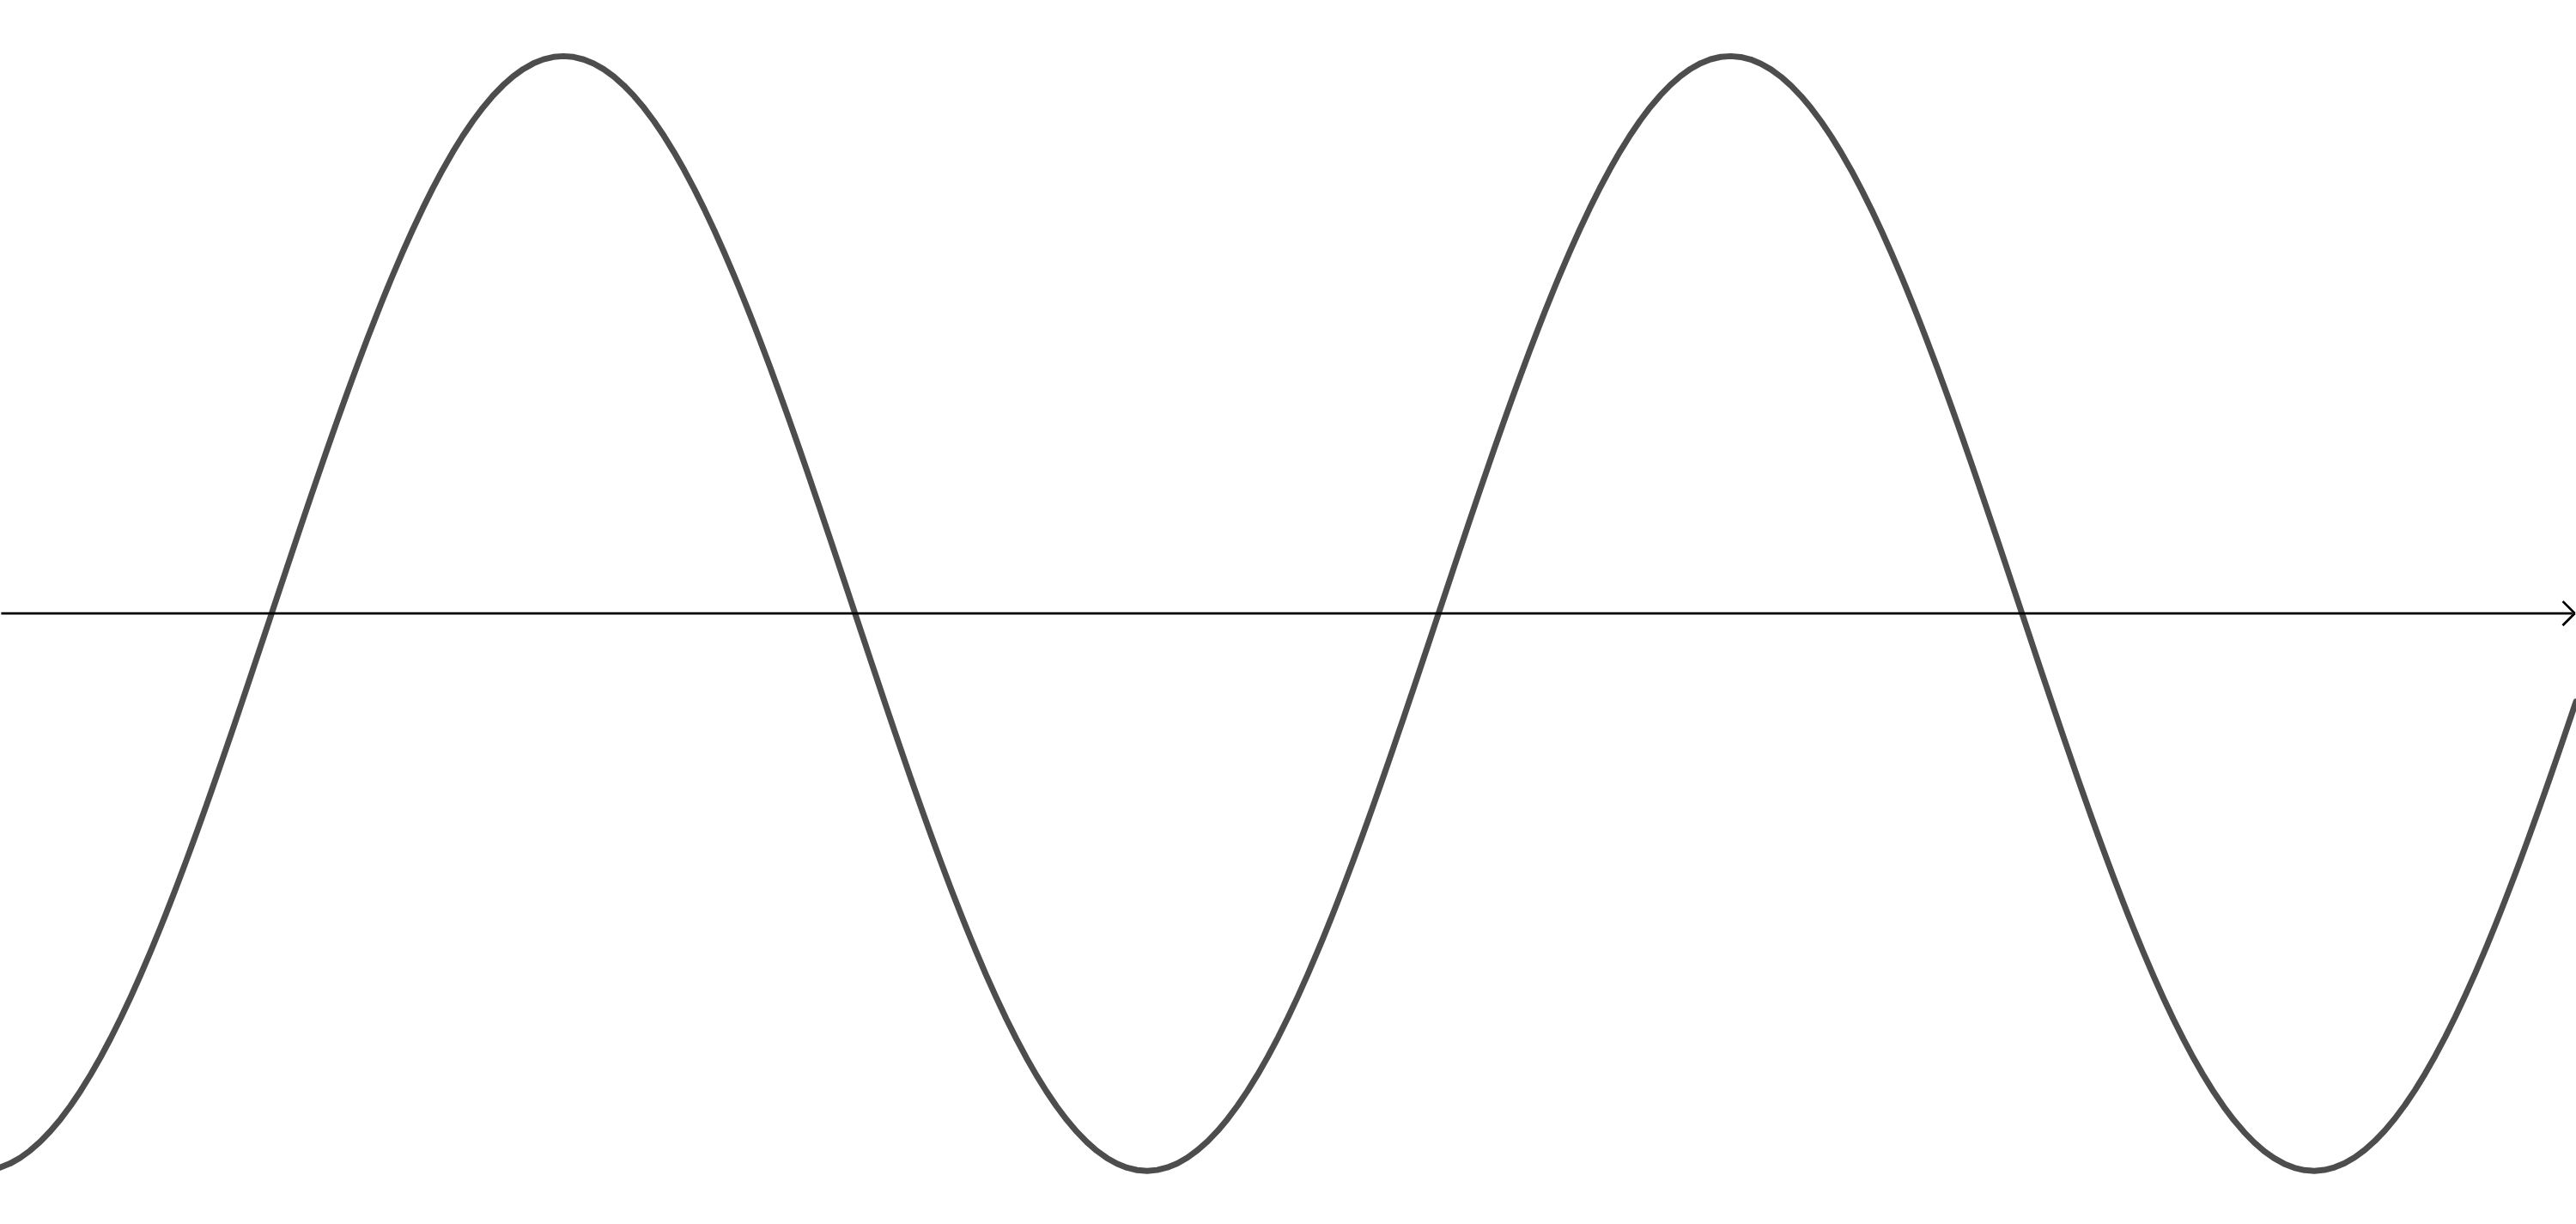
Look at the following four representations of sounds. Which one represents the:
- loudest sound?
- sound with the highest pitch?
- softest sound?
- sound with the lowest pitch?
Try and answer these for yourself before you read on.
- .

- .

- .
- .

- Image 1 is the wave with the smallest frequency. Therefore, it represents the sound with the lowest pitch.
- Image 2 is the wave with the highest frequency. Therefore, it represents the sound with the highest pitch.
- Image 3 is the wave with the greatest amplitude. Therefore, it represents the loudest sound (or more accurately, the sound with the greatest intensity).
- Image 4 is the wave with the smallest amplitude. Therefore, it represents the sound with the lowest intensity.
Example 2.1
Study the following wave diagram representing a musical note.

Redraw the wave for a note:
- with a higher pitch but the same loudness as the original sound
- that is louder but with the same pitch as the original sound
- that is softer but with the same pitch as the original sound.
Solution
- The original wave is the dashed line. A sound with a higher pitch will be the result of a sound wave with a higher frequency.

- The original wave is the dashed line. A sound which is perceived as louder will be the result of a sound wave with a greater intensity and hence a greater amplitude.
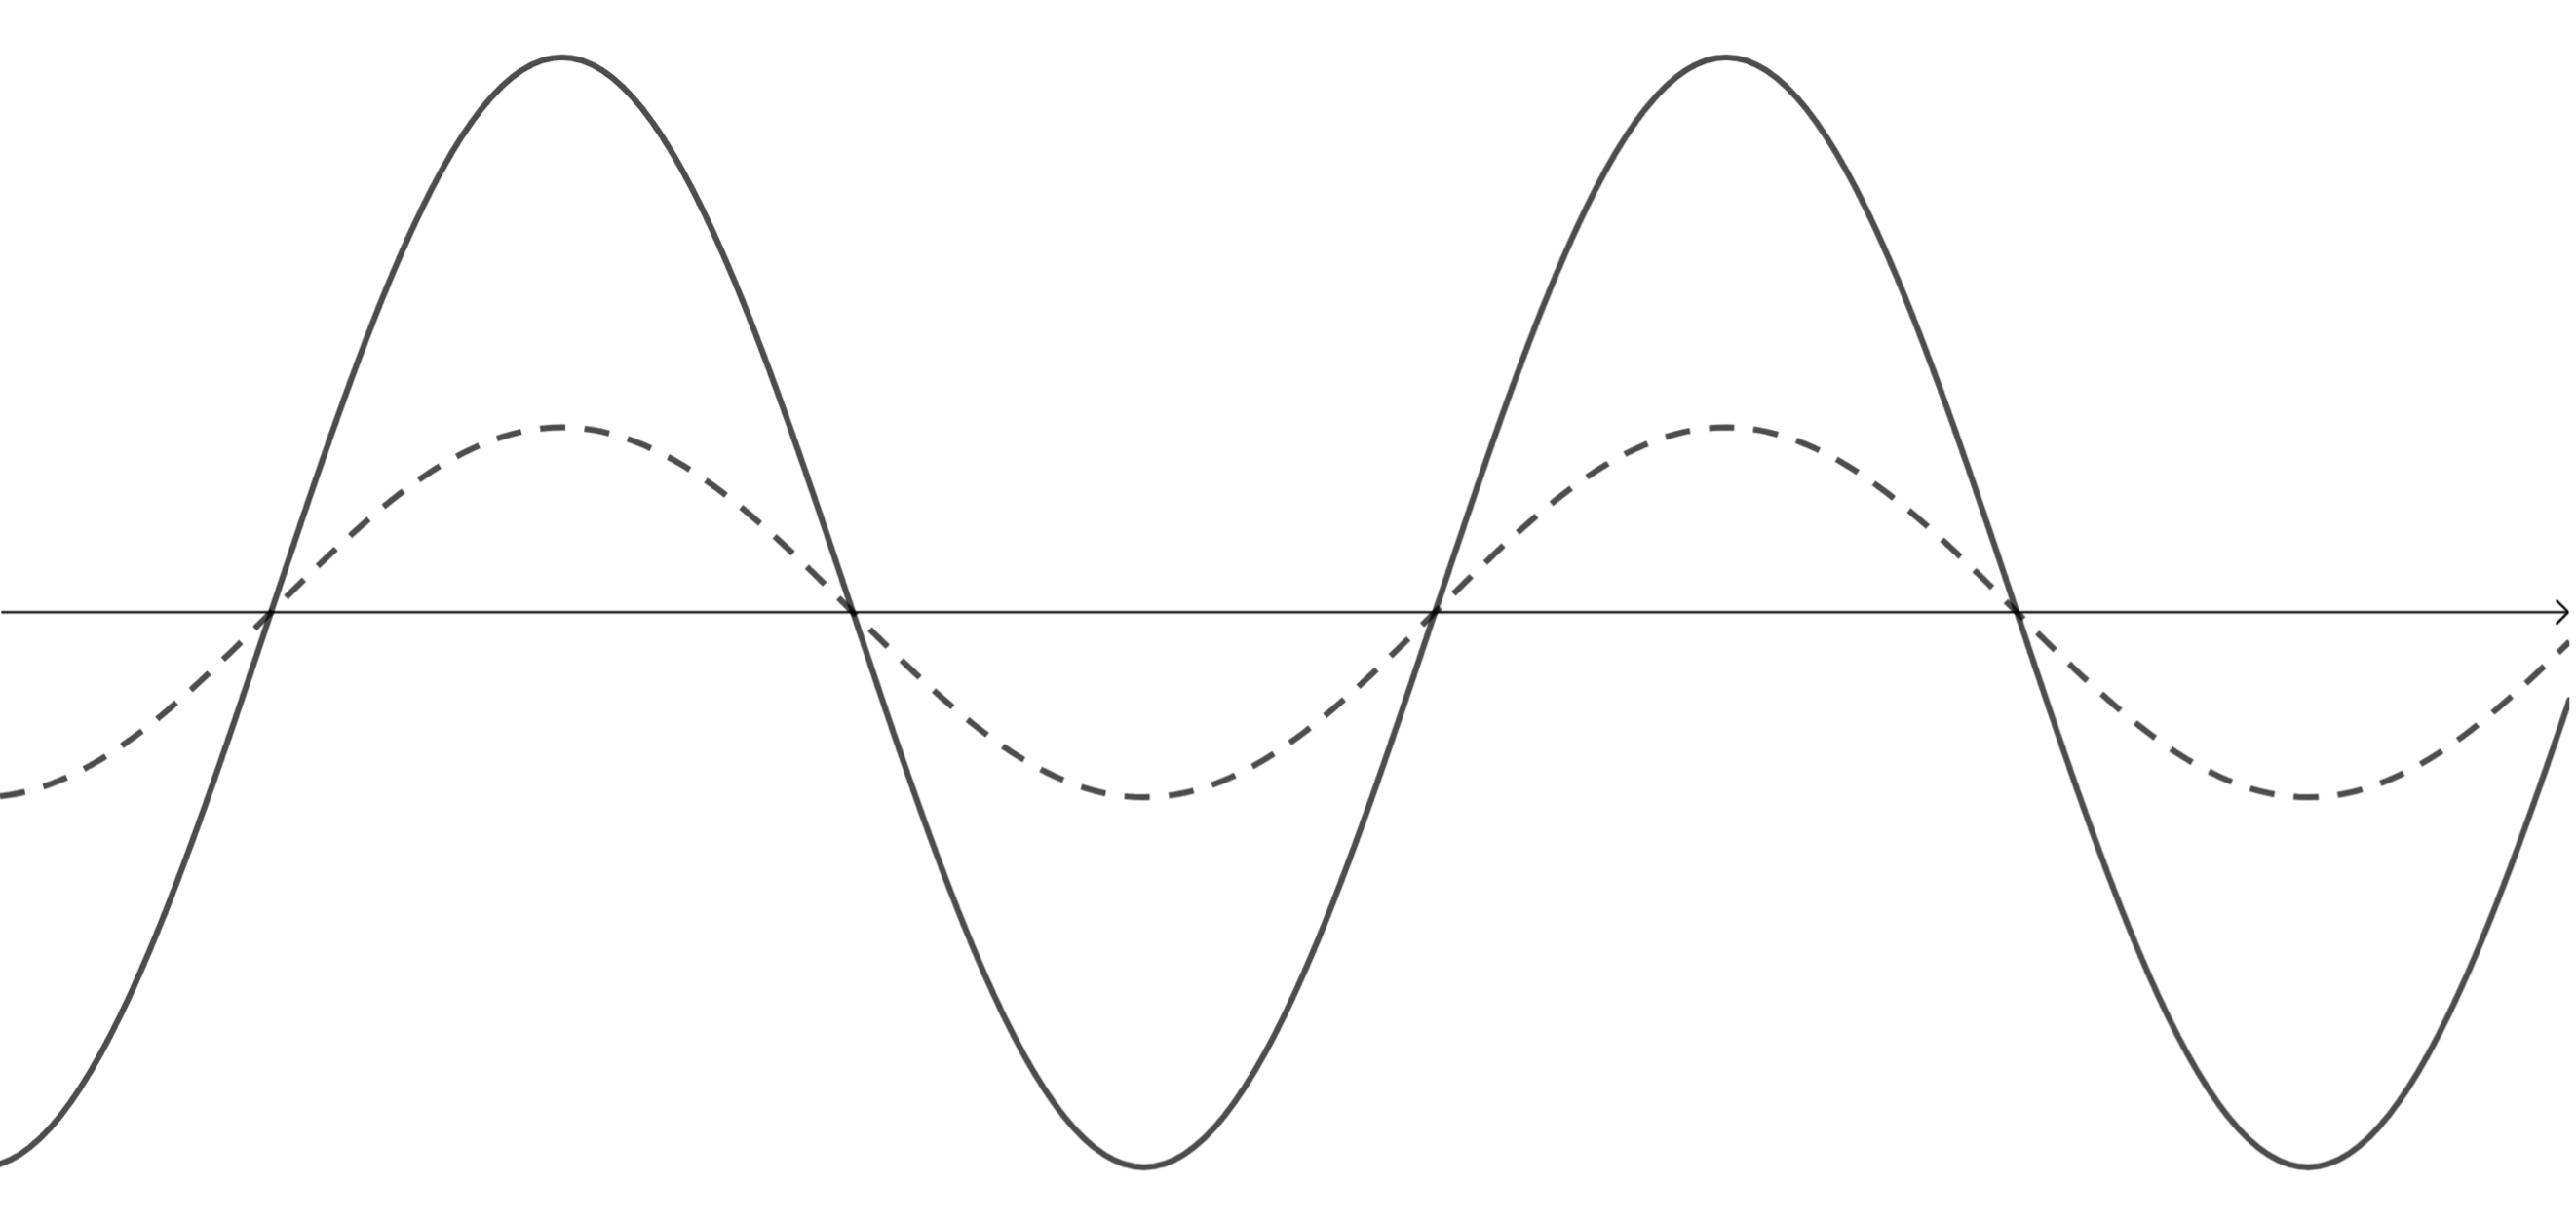
- The original wave is the dashed line. A sound which is perceived as softer will be the result of a sound wave with a lesser intensity and hence a smaller amplitude.

Exercise 2.1
- Which word from column A best describes or explains the idea in column B?
Column A Column B Longitudinal wave The pitch of a sound Amplitude The loudness of a sound Frequency Power per square metre Intensity Speed - A drum, a tin can and a motor are all producing sounds. This is because they are all in a state of:
- rarefaction
- compression
- flux
- rotation
- tension
- vibration
- If a drummer wanted to make his snare drum sound a slightly higher pitch, what would he need to do?
- Hit the drum softer.
- Hit the drum harder.
- Hit the drum with his finger rather than a drumstick.
- Tighten the velum (the drum skin)
- Loosen the velum (the drum skin)
- What is the range of the average healthy human ear?
- [latex]\scriptsize 0.2\ \text{Hz}\to 200\ \text{Hz}[/latex]
- [latex]\scriptsize 2\ \text{Hz}\to 2\ 000\ \text{Hz}[/latex]
- [latex]\scriptsize 20\ \text{Hz}\to 20\ 000\ \text{Hz}[/latex]
- [latex]\scriptsize 200\ \text{Hz}\to 200\ 000\ \text{Hz}[/latex]
- [latex]\scriptsize 2\ 000\ \text{Hz}\to 2\ 000\ 000\ \text{Hz}[/latex]
- Study the following wave diagram representing a musical note:

Redraw the wave for a note:- with a lower pitch but with the same loudness
- that is louder and has a higher pitch.
The full solutions can be found at the end of the unit.
Reflection of sound waves
Reflections and echoes
An echo forms when a sound wave bounces off a large solid object such as a wall or the side of a mountain. This ‘bouncing off’ is called reflection and is the same thing that happens to light that reflects off a mirror. You learnt about wave reflections in level 2 subject outcome 3.1 unit 2. We will also look more closely at the physics of how waves reflect off surfaces in the next subject outcome.
Sound waves are always reflecting off objects. This is why we can hear people that are in another room. The sound waves reflect off the walls, floor and ceiling to make it to our ears. We only hear reflections clearly as echoes when the sound is loud, the reflecting object is large and flat and there are few other objects in the way.
By changing the shape of the walls of a room or hall or covering the walls with special materials of special shapes, acoustic engineers can either eliminate almost all sound reflections (see figure 7) or get the sound to reflect in such a way as to make the room ‘sound’ great (see figure 8).


Sonar and echolocation
Some animals such as bats and dolphins use the reflection of sound waves off objects in the environment to create very accurate representations of the environment. This is called echolocation. The animal basically shouts out and then listens for the echo. The time it takes the echo to reach their ears and the way that the echo is different from the original sound wave are interpreted by the animal’s brain to help them ‘see’ what is around them.
Note
If you have an internet connection, watch the video called Echolocation, the Animal 6th Sense for a simple explanation of echolocation.
It is not just animals that use echolocation and the reflection of sound waves. Humans have designed similar systems to ‘see’ things we cannot ordinarily see and to accurately measure the distances of far away objects.
One technology that allows us to ‘see’ inside the human body, for example, is ultrasound. As the name suggests, this technology uses very high-frequency sound waves in the ultrasound range to create a picture of what is going on inside our bodies and other objects. Ultrasound is routinely used to check on the health of foetuses as they grow inside a mother’s uterus (see figure 9).

Sometimes the energy of ultrasound can be focused and targeted to deliver energy to specific points for specific purposes such as breaking up kidney stones or cleaning delicate equipment.
Another use of ultrasound is sonar. Sonar sends out ultrasound pulses and times the length of time it takes for the ‘echo’ to return. Using the time of this delay, the sonar machine can determine if there is an object in the environment and how far away it is. You may have seen simple sonar devices at work in some shops which use automatic doors. As you approach the door, the sound waves reflect off you telling the door that you are there and to open for you.
Activity 2.1: Measure the speed of sound in air
Time required: 15 minutes
What you need:
- a large wall
- a stopwatch
- a tape measure or ruler
- something to make a loud sound with
What to do:
- By using the reflection of sound, you can measure the speed of sound in the air. All you need is a large flat wall in an open space (like a hall) and a stopwatch.
- Measure your distance from the large flat wall in metres. Make sure you are at least [latex]\scriptsize 40\ \text{m}[/latex] away.
- Get the stopwatch on your mobile phone ready. Make a loud noise by shouting or hitting something and at the exact same time start the stopwatch.
- As soon as you hear the echo of the sound off the wall, stop the stopwatch. Record the length of time taken for the sound to return to you. Repeat this process at least ten times.
- Find the average of all the times you recorded.
- Using the fact that speed is equal to distance divided by time, calculate the speed at which the sound travelled.
- Why is it easier to use the time of an echo to measure the speed of sound than just shouting at someone across a field.
- Why is it necessary to repeat the experiment several times?
- Why is it best to be as far away from the wall as possible?
What did you find?
The time it takes for you to hear the echo after you made the original sound will differ depending on the distance you stand from the wall. However, by using the formula [latex]\scriptsize \text{speed}=\displaystyle \frac{{\text{distance}}}{{\text{time}}}[/latex] you should have found that the speed of sound in the air is approximately [latex]\scriptsize 300-350\ \text{m.s}^{-1}[/latex] For example, if you were standing [latex]\scriptsize 40\ \text{m}[/latex] from the wall, the total distance the sound would have to travel would be [latex]\scriptsize 80\ \text{m}[/latex]. If it took [latex]\scriptsize 0.23\ \text{s}[/latex] for you to hear the echo, this would mean that the speed of sound is:
[latex]\scriptsize \text{speed}=\displaystyle \frac{{80\ \text{m}}}{{0.23\ \text{s}}}=347\ \text{m.s}^{-1}[/latex]
It is best to use the return time of the echo for two reasons. Firstly, this doubles the distance that the sound needs to travel making it easier to start and stop the stopwatch in time. Secondly, it means that the same person can start and stop the stopwatch without the need to synchronise the watches of the person making the sound and the person hearing the sound.
Whenever we do a science experiment, it is important to repeat the experiment several times. This ensures that the results are repeatable and that any once-off errors are worked out of the results.
The further away from the wall you are, the longer it will take the echo to return to you making the starting and stopping of the watch a little easier and more accurate.
Example 2.2
A ship uses sonar to send a signal to the bottom of the ocean to determine the depth of the ocean at that point. The speed of sound in sea water is [latex]\scriptsize 1\ 450\ \text{m}\text{.}{{\text{s}}^{{-1}}}[/latex]. If the signal is received [latex]\scriptsize 1\ 675\ \text{s}[/latex] later, how deep is the ocean at that point?
Solution
We know that [latex]\scriptsize \text{speed}=\displaystyle \frac{{\text{distance}}}{{\text{time}}}[/latex]. Therefore, we can rearrange the equation to make distance the subject.
[latex]\scriptsize \begin{align*}\text{distance}&=\text{speed}\times \text{time}\\&=\text{1}\ \text{450}\ \text{m.s}^{-1}\times 1.675\ \text{s}\\&=\text{2}\ \text{428}\text{.75}\ \text{m}\end{align*}[/latex]
Summary
In this unit you have learnt the following:
- The loudness of a sound is determined by the amplitude of the sound wave. The greater the amplitude, the greater the perceived loudness.
- The objective ‘loudness’ of a sound wave is measured as intensity which is the energy of the sound wave per unit area.
- The pitch of a sound is determined by the frequency of the sound wave. The higher the frequency, the higher the pitch.
Unit 2: Assessment
Suggested time to complete: 40 minutes
- If the amplitude and frequency of a sound wave are both decreased, how is the loudness and pitch of the sound affected?
- A dolphin emits an ultrasonic wave with a frequency of [latex]\scriptsize 0.2\ \text{MHz}[/latex]. The speed of sound in sea water is [latex]\scriptsize \displaystyle 1\ 500\ \text{m}\text{.}{{\text{s}}^{{-1}}}[/latex]. What is the wavelength of this wave?
- A farmer shouts to someone at the other end of a field [latex]\scriptsize 135\ \text{m}[/latex] away. If the speed of sound is [latex]\scriptsize 344\ \text{m}\text{.}{{\text{s}}^{{-1}}}[/latex], how long does it take the sound to reach the other person?
- A sonar pulse reflects off an object and returns to the source in [latex]\scriptsize 0.525\ \text{s}[/latex]. If the speed of sound is [latex]\scriptsize 344\ \text{m}\text{.}{{\text{s}}^{{-1}}}[/latex], how far away is the object?
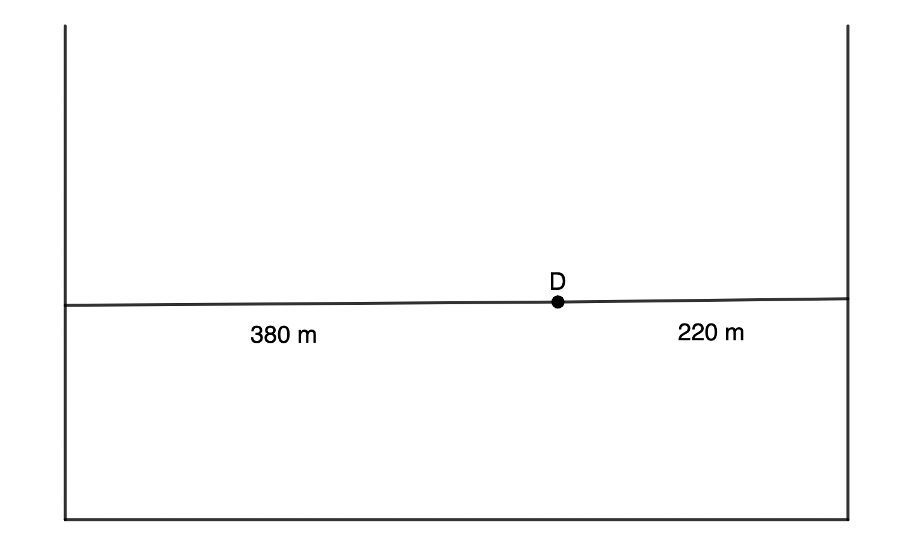
- A learner stands between two cliff faces at point [latex]\scriptsize D[/latex] as shown in the diagram. She stands facing the nearer cliff and claps her hands once. If the speed of sound in air is about [latex]\scriptsize 344\ \text{m}\text{.}{{\text{s}}^{{-1}}}[/latex], what will be the time between the two echoes she will hear?
- A mosquito beats its wings [latex]\scriptsize 600[/latex] times a second. Assuming the sound travels at [latex]\scriptsize 344\ \text{m}\text{.}{{\text{s}}^{{-1}}}[/latex], calculate the frequency and wavelength of the sound.
- If people can detect frequencies up to [latex]\scriptsize 20\ 000\ \text{Hz}[/latex] and the speed of sound in water is [latex]\scriptsize 1\ 500\ \text{m}\text{.}{{\text{s}}^{{-1}}}[/latex], what is the wavelength of the sound at the limits of audible hearing in water.
The full solutions can be found at the end of the unit.
Unit 2: Solutions
Exercise 2.1
- The pitch of a sound is the result of the frequency of the sound wave.
The loudness of a sound is the result of the intensity of the sound wave.
The power per square metre transmitted by the sound wave is the result of the amplitude of the sound wave. - The correct answer is vibration. Objects which vibrate make sounds. As they vibrate, they cause the air molecules to vibrate which creates a sound wave. The vibrations of the air molecules are captured by our ears and interpreted by our brains as sounds.
- The correct answer is to tighten the velum (the drum skin). By tightening the velum, it will vibrate at a higher frequency, creating a sound with a higher pitch.
- The correct answer is [latex]\scriptsize 20\ \text{Hz}\to 20\ 000\ \text{Hz}[/latex].
- .
- A lower pitch is the result of a sound with a lower frequency. The dotted line is the original wave.

- A higher pitch is the result of a sound with a higher frequency. A louder sound is the result of a greater amplitude. The dotted line is the original wave.

- A lower pitch is the result of a sound with a lower frequency. The dotted line is the original wave.
Unit 2: Assessment
- If the amplitude is decreased, the intensity and hence the loudness of the sound will decrease. If the frequency is decreased, the pitch will decrease.
- .
[latex]\scriptsize \begin{align*}v & =f\times \lambda \\\therefore \lambda & =\displaystyle \frac{v}{f}=\displaystyle \frac{{1\ 500\ \text{m}\text{.}{{\text{s}}^{{\text{-1}}}}}}{{200\ 000\ \text{Hz}}}=0.0075\ \text{m}\end{align*}[/latex] - .
[latex]\scriptsize \begin{align*}\text{speed}&=\displaystyle \frac{{\text{distance}}}{{\text{time}}}\\\therefore \text{time}&=\displaystyle \frac{{\text{distance}}}{{\text{speed}}}=\displaystyle \frac{{135\ \text{m}}}{{344\ \text{m}\text{.}{{\text{s}}^{{\text{-1}}}}}}=0.39\ \text{s}\end{align*}[/latex] - .
[latex]\scriptsize \begin{align*}\text{velocity} & =\displaystyle \frac{{\text{displacement}}}{{\text{time}}}\\\therefore \text{displacement} & =\text{velocity}\times \text{time}=344\ \text{m}\text{.}{{\text{s}}^{{\text{-1}}}}\times 0.525\ \text{s}=186.38\ \text{m}\end{align*}[/latex]
Note: It is best to use the vector quantities of velocity and displacement rather than speed and distance. - Echo off the cliff in front:
[latex]\scriptsize \begin{align*}\text{velocity}&=\displaystyle \frac{{\text{displacement}}}{{\text{time}}}\\\therefore \text{time}&=\displaystyle \frac{{\text{displacement}}}{{\text{velocity}}}=\displaystyle \frac{{220\ \text{m}}}{{344\ \text{m}\text{.}{{\text{s}}^{{\text{-1}}}}}}=0.64\ \text{s}\end{align*}[/latex]
Echo off the cliff behind:
[latex]\scriptsize \begin{align*}\text{velocity}&=\displaystyle \frac{{\text{displacement}}}{{\text{time}}}\\\therefore \text{time}&=\displaystyle \frac{{\text{displacement}}}{{\text{velocity}}}=\displaystyle \frac{{380\ \text{m}}}{{344\ \text{m}\text{.}{{\text{s}}^{{\text{-1}}}}}}=1.105\ \text{s}\end{align*}[/latex]
Time difference: [latex]\scriptsize 1.105\ \text{s}-0.64\ \text{s}=0.465\ \text{s}[/latex] - The frequency has been given: [latex]\scriptsize f=600\ \text{Hz}[/latex].
[latex]\scriptsize \begin{align*}v & =f\times \lambda \\\therefore \lambda & =\displaystyle \frac{v}{f}=\displaystyle \frac{344\ \text{m.s}^{-1}}{600\ \text{Hz}}=0.573\ \text{m}\end{align*}[/latex] - .
[latex]\scriptsize \begin{align*}v & =f\times \lambda \\\therefore \lambda & =\displaystyle \frac{v}{f}=\displaystyle \frac{1\ 500\ \text{m.s}^{-1}}{20\ 000\ \text{Hz}}=0.075\ \text{m}\end{align*}[/latex]
Media Attributions
- figure1 © lunar caustic is licensed under a CC BY (Attribution) license
- figure2 © Pluke is licensed under a CC0 (Creative Commons Zero) license
- figure3 © Lumen Learning is licensed under a CC BY (Attribution) license
- figure4 © Flexbooks is licensed under a CC BY-NC (Attribution NonCommercial) license
- figure5 © Flexbooks is licensed under a CC BY-NC (Attribution NonCommercial) license
- figure6 © Pluke is licensed under a CC0 (Creative Commons Zero) license
- sound1 © Geogebra is licensed under a CC BY-SA (Attribution ShareAlike) license
- sound2 © Geogebra is licensed under a CC BY-SA (Attribution ShareAlike) license
- sound3 © Geogebra is licensed under a CC BY-SA (Attribution ShareAlike) license
- sound4 © Geogebra is licensed under a CC BY-SA (Attribution ShareAlike) license
- example2.1 © Geogebra is licensed under a CC BY-SA (Attribution ShareAlike) license
- example2.1A1 © Geogebra is licensed under a CC BY-SA (Attribution ShareAlike) license
- example2.1A2 © Geogebra is licensed under a CC BY-SA (Attribution ShareAlike) license
- example2.1A3 © Geogebra is licensed under a CC BY-SA (Attribution ShareAlike) license
- exercise2.1Q5
- figure7 © David Goehring is licensed under a CC BY (Attribution) license
- figure8 © Nick-D is licensed under a CC BY-SA (Attribution ShareAlike) license
- figure9 © Nevit Dilmen is licensed under a CC BY-SA (Attribution ShareAlike) license
- assessmentQ5 © Geogebra is licensed under a CC BY-SA (Attribution ShareAlike) license
- exercise2.1A5a © Geogebra is licensed under a CC BY-SA (Attribution ShareAlike) license
- exercise2.1A5b © Geogebra is licensed under a CC BY-SA (Attribution ShareAlike) license
